

Excel handles project management well for small to mid sized projects, roughly up to 150 to 200 tasks with a team under 15 people editing regularly. It's genuinely strong for task trackers, lightweight Gantt views, budgets, and quick dashboards. Where it falls over is notifications, dependency management, audit trails, and anything with heavy concurrent editing.
TL;DR:
- Excel is suitable for small projects with up to 200 tasks and fewer than 15 team members, but struggles with dependency management and notifications.
- Using structured tables, data validation, conditional formatting, and a dedicated dashboard creates a reliable, self-updating project tracker in less than an hour.
- Visualizing timelines with conditional formatting Gantt or chart-based methods helps track milestones and detect delays at a glance.
- Collaboration requires protecting formula cells and relying on conditional formatting rather than manual color fills to keep visual cues accurate.
- Moving beyond Excel becomes necessary once projects exceed 150-200 tasks or involve complex dependencies, with dedicated tools providing features like auto notifications and audit trails.
Table of Contents
- Which Excel project management templates should you start with?
- How do you build a self-updating project tracker in Excel?
- How do you visualise a project timeline with Gantt bars in Excel?
- What KPIs should a project dashboard in Excel track?
- Can multiple people safely collaborate on an Excel project tracker?
- When should you move on from Excel for project management?
- How do you manage resource allocation and workload in Excel?
- Can you automate project tasks in Excel with macros or VBA?
- How do you connect Excel project files to Outlook and Power BI?
- Author perspective: quick habits that keep a tracker useful
- Seven: a spreadsheet-friendly next step for teams that need more
- Sources
Which Excel project management templates should you start with?
Don't build from a blank sheet. The template you pick shapes how much rework you'll do in week three, so match it to the job rather than grabbing whatever looks impressive.
- Project tracker template: a single flat table for task-level tracking, with roll-up KPIs calculated off it. This is the workhorse for most small projects.
- Gantt or project schedule template: a visual timeline for sequencing tasks and flagging milestones, useful once you've got more than a handful of dependencies.
- Timeline or milestone chart: a lighter visual, built for stakeholder updates rather than day-to-day management.
- Budget and resource templates: for task-level cost tracking and allocation across a team or vendor list.
- Risk register template: a concise log of risks, owners, and mitigation steps, kept separate from the main tracker.
Microsoft's own Excel template gallery has ready-made versions of most of these, which saves you the setup time if you just need something functional today. If your project needs formal governance documentation, PMI's template library covers risk registers and charter templates that go further than a spreadsheet typically needs to.
How do you build a self-updating project tracker in Excel?
This is the part most guides skip, or rush through with screenshots instead of instructions. Here's the actual sequence, and you can finish it in under an hour.
- Build a flat task table first. One row per task, no merged cells, no blank rows. Then select it and press Ctrl+T to convert it to a proper Excel Table. This single step is what lets formulas and validation auto-fill as you add rows.
- Set your columns. At minimum: Task ID, Task name, Owner, Start date, Due date, Status, % complete, Effort, Dependency, and Notes.
- Add data validation lists for Status (e.g. Not started, In progress, Blocked, Done) and Priority, so nobody free-types "kinda done" into a status field.
- Write the core formulas. Days left:
=[@[Due date]]-TODAY(). Overall % complete: either a straight average or, better, aSUMPRODUCTweighted by effort, so a five-minute task doesn't count the same as a five-week one. UseCOUNTIFSfor status summaries. - Apply conditional formatting rules, not manual fills, for overdue tasks, tasks due soon, and closed tasks. Base every rule on a formula referencing the date or status column.
- Publish a dashboard on its own sheet that reads from the table via structured references only, never a second place where someone types data by hand.
This structure is what separates a tracker that survives 50+ rows from one that quietly falls apart, because structured tables and rule-based formatting scale in a way manual entry never does. A tutorial-style walkthrough of the same build is worth following once if you want to see it done live rather than read it.
Pro Tip: Build the Table first, before you write a single formula. Every formula and validation rule you add afterwards inherits the Table's structure automatically, which is the whole point.
How do you visualise a project timeline with Gantt bars in Excel?
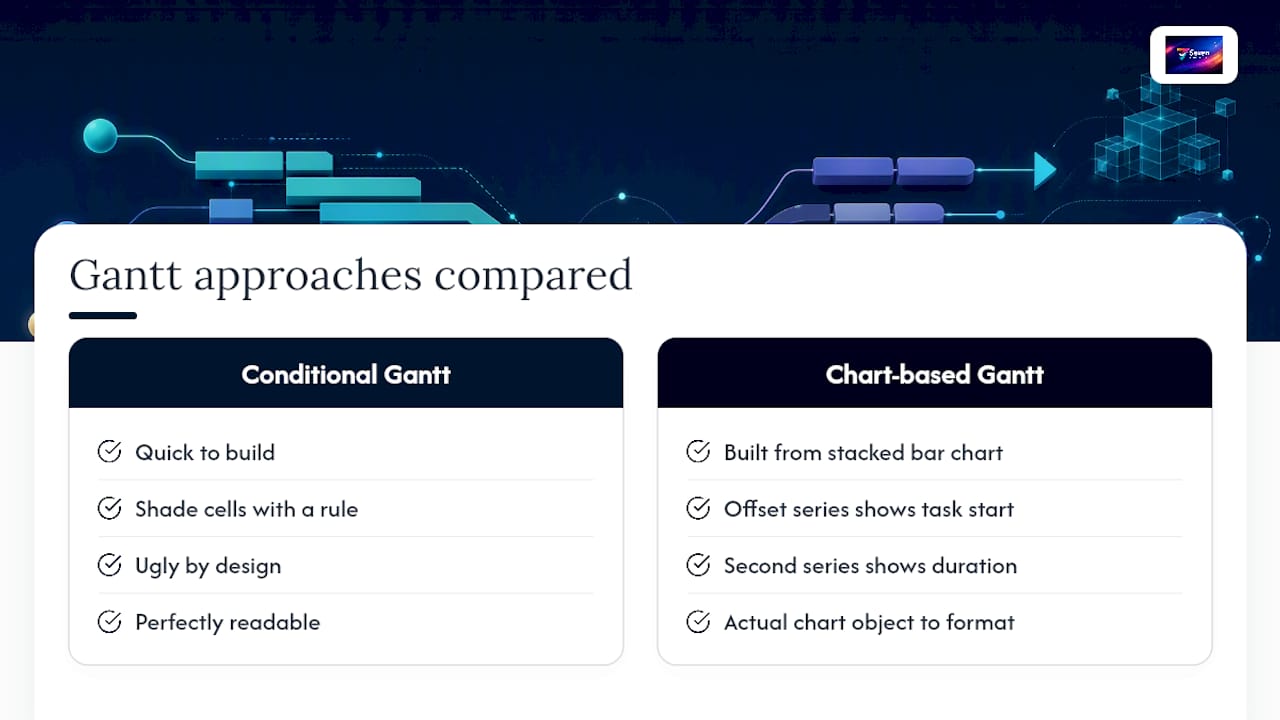
Two approaches cover almost everyone. The first is conditional-formatting Gantt: lay out a row of dates across the top, then shade cells with a rule like =AND(date>=start,date<=end). It's quick, ugly by design, and perfectly readable.
The second is a chart-based Gantt, built from a stacked bar chart where one series represents the offset before a task starts and the second represents its duration. This gives you an actual chart object you can format, resize, and drop into a status report.
Whichever you use, show planned versus actual durations side by side and mark milestones distinctly, so a reviewer can see slippage at a glance. Keep the timeline on its own sheet, separate from your task table, so it prints cleanly without dragging your whole tracker onto one page.
What KPIs should a project dashboard in Excel track?
Four numbers cover most projects: weighted percent complete, task counts by status, an overdue count, and a rough resourcing check. Skip anything fancier until one of these tells you it's needed.
Counts by status and overdue counts both run cleanly off COUNTIFS against your Table.
The one rule that matters more than any formula: never type data directly onto the dashboard sheet. Every cell should reference the task table through structured references, so the dashboard updates itself the moment someone edits a task. Keep the visuals simple too. An in-cell data bar, one big KPI number for percent complete, and a small status breakdown chart tell the story faster than a page of charts nobody reads before a meeting.
Can multiple people safely collaborate on an Excel project tracker?
Yes, with limits worth knowing before you find them the hard way. OneDrive or SharePoint co-authoring lets several people edit the same file live, and it's the closest Excel gets to real collaboration. Protect the cells holding formulas so a stray keystroke doesn't wipe out your percent-complete calculation.
The habit to break early: manual colour fills. If someone highlights a row orange by hand to mean "at risk", that flag never updates again and nobody remembers what orange meant three weeks later. Conditional formatting tied to the actual data keeps every visual cue honest, because it recalculates every time the sheet opens.
Lock ranges or protect sheets where you can, and lean on version history when someone inevitably breaks a formula. Once several editors start working the same file daily, export the table for reporting or look at a dedicated tool built for concurrent editing.
When should you move on from Excel for project management?
There's a point where a spreadsheet stops being the efficient option and starts being the risky one. The rough thresholds: more than 150 to 200 tasks, more than 10 to 15 people editing simultaneously, or dependency chains complex enough that a single date change should cascade through a dozen other tasks automatically. Excel works best on smaller projects and teams; past that scale, dedicated software earns its cost.
The functional gaps show up before the row count does: no automated notifications when a task goes overdue, no dependency-aware rescheduling, no audit trail of who changed what, and no scalable place for task-level discussion.
Migrating isn't complicated. Export your Table as a CSV, keep the column names and Task IDs intact, and test the import into your destination tool with a handful of rows before you commit the whole tracker. If you're weighing that decision, a rundown of planning tools worth comparing is a reasonable next stop.
How do you manage resource allocation and workload in Excel?
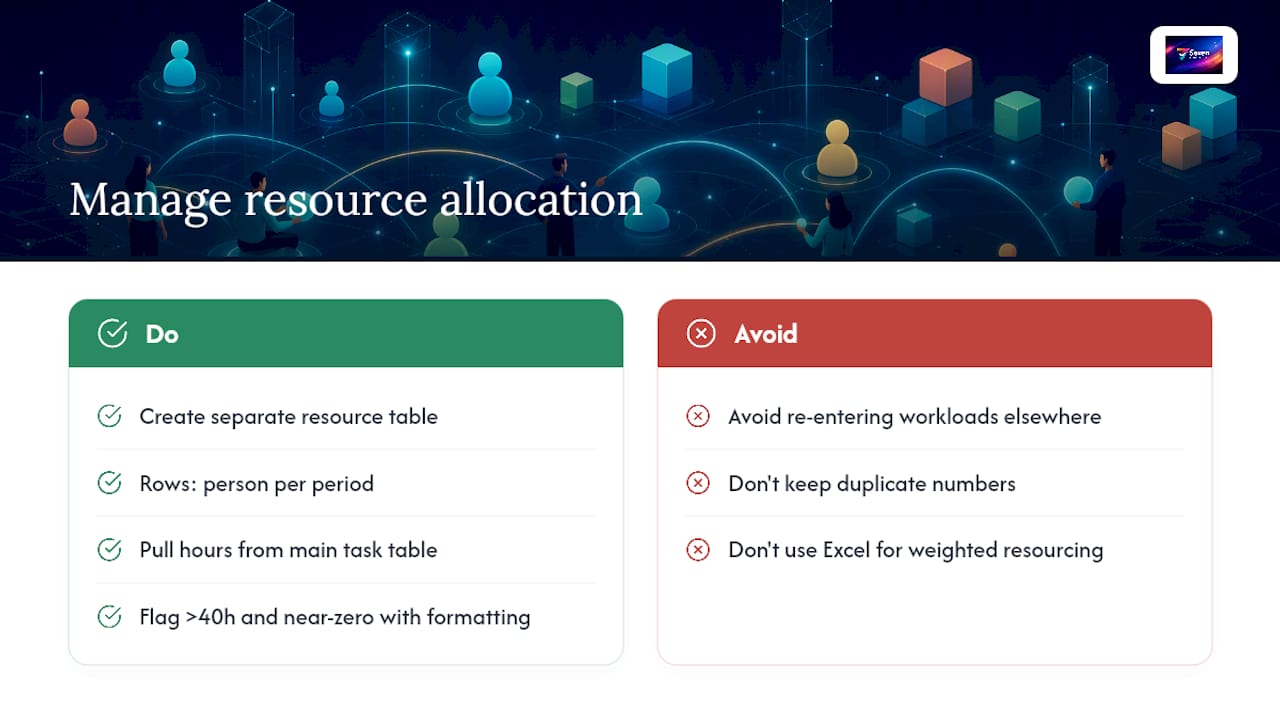
Most teams get workload wrong not because they lack data, but because they store it in the wrong shape. A resource allocation view needs its own table, separate from the task tracker, with one row per person per week or sprint, and a column for hours or effort assigned against each task.
Build a simple matrix: people down the rows, time periods across the columns, and use SUMIFS pulling effort figures from your main task Table filtered by Owner and date range. That gives you total allocated hours per person per period without retyping anything.
Conditional formatting earns its keep here too. Set a rule that shades a cell when allocated hours exceed a threshold (say, more than 40 hours a week), so overloading jumps out visually rather than requiring you to eyeball a column of numbers. A second rule flagging near-zero allocation catches the opposite problem: someone with capacity nobody's using.
The trap to avoid is manually re-entering the same person's workload in a second sheet "for reporting purposes." Every number that exists in two places eventually disagrees with itself. Keep resourcing data flowing from the single source table, using structured references the same way your dashboard does, and update assignments in one place only.
For anything beyond simple hour totals, weighted by skill or by task priority, you're pushing at the edge of what a spreadsheet should reasonably do. That's usually the first sign resourcing has outgrown Excel before the task count has.
Can you automate project tasks in Excel with macros or VBA?
Yes, and it's worth learning a handful of macros even if you never touch VBA otherwise. The tasks worth automating are the repetitive, mechanical ones: archiving completed tasks to a separate sheet, generating a weekly status email body from your dashboard figures, or resetting a template for a new project cycle.
A basic macro recorded through Excel's macro recorder handles most of this without writing a line of code. Open the Developer tab, hit Record, do the task once by hand (say, filtering completed rows and copying them to an archive sheet), stop recording, and you've got a button that repeats it in one click from then on.
VBA proper comes in when the logic needs a condition the recorder can't capture, like "only archive tasks completed more than 30 days ago" or "send a notification only if the overdue count changed since yesterday." That's a short script, not a full application, and most project managers can pick up enough VBA syntax for these specific jobs in an afternoon.
The caution here: a macro-heavy tracker becomes fragile the moment someone else needs to edit it and doesn't know the macros exist. Document what each button does in a visible cell nearby, and keep the underlying data structure clean enough that the sheet still works even if every macro were deleted tomorrow. Automation should sit on top of good structure, not substitute for it.
How do you connect Excel project files to Outlook and Power BI?
Excel rarely lives in isolation once a project gets real traction, and two integrations come up constantly. The first is Outlook. You can pull due dates from your task Table and generate calendar entries or reminder emails using a macro that loops through rows and calls Outlook's object model, though for most teams a simpler approach works just as well: export a filtered view of upcoming due dates and paste it into a recurring status email.
The second is Power BI, which is where Excel dashboards genuinely start to strain. If your project data lives in a Table with clean structured references, Power BI can connect to that workbook directly and refresh its visuals whenever the source file updates. This matters most when you're reporting across several projects at once, something a single Excel dashboard was never built to do cleanly.
Neither integration fixes the core limitation, though: Excel still has no native way to notify someone the moment a task changes, and both Outlook and Power BI connections are pulling from a file that someone still has to update by hand. If your team is already exploring workflow automation around Excel, it's worth reading how AI-assisted productivity workflows are being used to cut down that manual update step, and organisations juggling several integrated systems sometimes reach the point where custom automation beyond spreadsheets makes more sense than stitching another connector onto Excel.
Author perspective: quick habits that keep a tracker useful
Most Excel trackers don't fail because of a bad formula. They fail because three people kept three versions and nobody agreed which one was real. Keep exactly one canonical file, update it daily, and enforce structure with Tables and validation from the first hour, not after the third mess. Discipline beats cleverness here. A tracker with basic formulas and rigid structure will outlast a beautifully engineered one that lets people type whatever they want into a status column.
— Greg
Seven: a spreadsheet-friendly next step for teams that need more
When your tracker outgrows what Excel can reasonably hold, Seventasks gives you a landing spot that doesn't force you to start from scratch. It imports tasks from existing spreadsheets, allowing the tracker you've already built to be the starting point rather than something you rebuild from memory in a new tool.
The platform is built without vendor lock-in, so project data stays exportable and owned by users, and it does not mine or sell data for analytics. That matters once a project holds client names, budgets, or anything you wouldn't want sitting in someone else's ad targeting profile. You get flexible workspaces, built-in messaging, and file attachments, the collaboration layer Excel never had, with no hidden fees stacked on top.
If your Excel tracker is starting to strain under concurrent editors or missed notifications, start a free trial on Seventasks and import your existing task list in a few minutes.
Sources
- Excel Project Tracker Tutorial — DataHub Pro
- Build a Project Tracker in Excel That Doesn’t Collapse at 50 Rows - Learn Excel
- Avoid manual cell colour-coding — service desk guidance