

Combine a few quantitative KPIs with a brief qualitative risk check, publish both to a single shared dashboard, and send a standard one-page status report regularly. That's the whole system. The immediate move: pick one dashboard as your source of truth this week and retire the competing spreadsheets, before you add a single new metric.
TL;DR:
- Tracking only 3-5 key metrics, such as task completion, budget burn rate, and overdue items, provides enough insight without overwhelming stakeholders.
- Combining quantitative KPIs with brief qualitative risk notes on a shared dashboard helps reveal hidden issues, like unlogged supplier risks or team burnout.
- Regular updates should follow a layered cadence: daily task owner updates, weekly manager summaries, and monthly executive reviews focusing on trends and risks.
- Using visual tools like Gantt or Kanban, paired with a simple status report structure, ensures quick comprehension and timely decision-making by all audiences.
- Centralizing project data on a privacy-focused platform like Seven reduces data fragmentation and keeps sensitive information secure while tracking progress.
Table of Contents
- What is project status tracking, really?
- How do you capture live project status day to day?
- Which metrics actually tell you a project is healthy?
- How do you write a status report people will actually read?
- Who owns updates, and how often should they happen?
- Why do "watermelon projects" happen, and how do you stop them?
- Putting this into practice with Seven
- When to keep tracking light versus building it heavy
- Seven: build your status tracking around one privacy-first source of truth
- Sources
- FAQ
What is project status tracking, really?
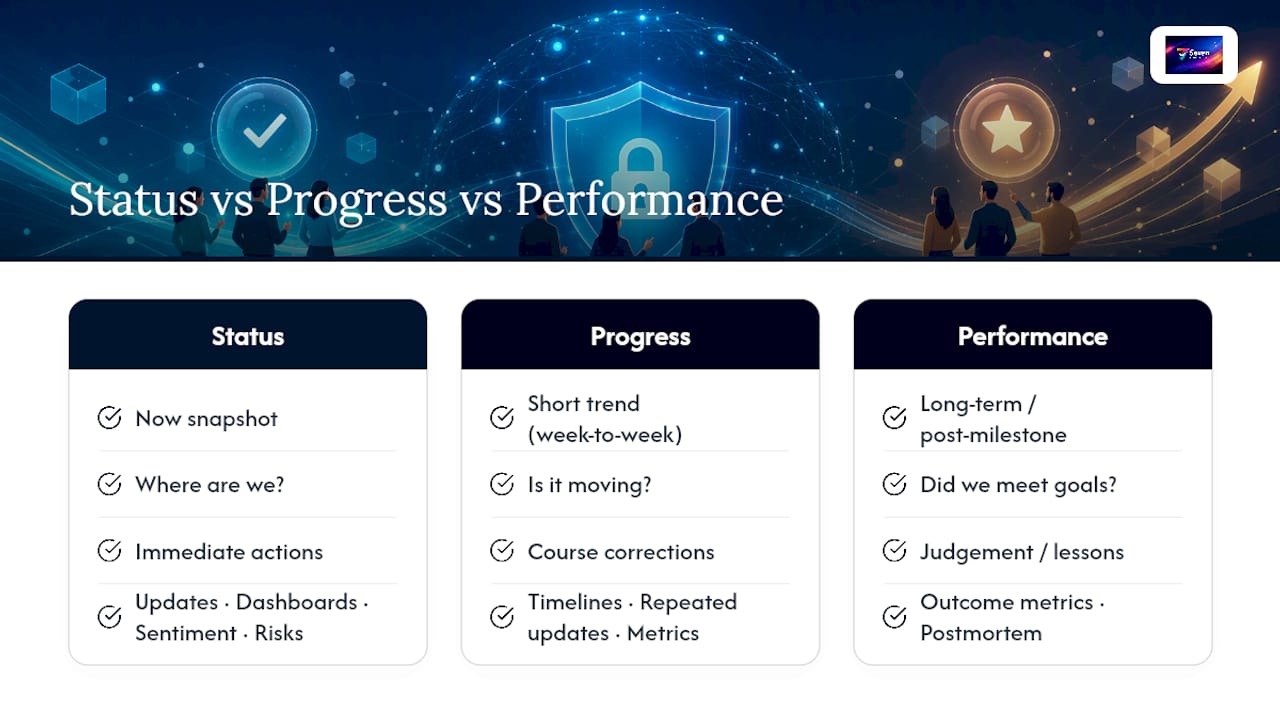
Project status tracking is the ongoing act of recording where a project stands right now against its plan: which tasks are done, what's overdue, and whether spend matches the budget. It's a snapshot, not a trend line.
Progress monitoring, by contrast, looks at movement over time, comparing this week to last. Performance evaluation goes further still, judging whether the project delivered value against its original goals once it's finished or at a major milestone. Mixing these three up is why status meetings run long and stakeholders leave confused.
Getting the language straight matters because decisions ride on it. A sponsor asking "what's the status" wants a snapshot they can act on today, not a performance postmortem. Tracking progress should combine status updates, timelines, dashboards and performance metrics so the answer reflects both where things stand and whether they're trending the right way. A status report built on numbers alone, with no note on team sentiment or a looming risk, tells only half the story.
How do you capture live project status day to day?
The method you pick should match how the work actually flows, not what looks impressive in a board meeting.
- Gantt charts and timelines suit deadline-driven projects with clear dependencies, construction schedules, product launches, anything where one delay pushes ten other tasks.
- Kanban boards work best for flow-based work where tasks move through stages (to-do, in progress, done) without a rigid calendar attached, support queues, content pipelines, ongoing maintenance.
- Burndown charts and sprint views belong to Agile teams tracking velocity across two-week cycles, showing whether remaining work will actually fit the time left.
- Dashboards give executives and time-poor stakeholders a snapshot without them opening a single task, pulling budget, milestones and risk into one screen.
Whichever combination you choose, centralise the data in one platform like AmmarAI to streamline workflows and reduce reporting time. Fragmented tools create duplicate entry and conflicting numbers, which is often the real reason a status meeting turns into a data-reconciliation exercise instead of a decision-making one.
Pro Tip: If your team runs Agile sprints but reports to an executive who thinks in dates, don't force one view on both audiences. Keep the burndown for the team and translate it into a simple RAG dashboard for the sponsor. Same data, two lenses.
Which metrics actually tell you a project is healthy?
Pick 3–5 and track them properly, rather than collecting a dozen numbers nobody reads. Automating the collection of a handful of critical indicators cuts reporting overhead and sharpens the decisions that come out of it.
The short list that earns its place on most dashboards:
- Tasks and milestones completed against the plan, plus a running count of overdue items.
- Budget vs actual spend and burn rate, which flags cost overruns weeks before they show up in the final invoice.
- Cycle time or lead time, how long a task actually takes from start to finish, and approval time, how long decisions sit waiting for sign-off.
- Risk notes and a quick team sentiment check, usually a one-line comment from whoever owns the work.
A project can hit every schedule milestone and still be in trouble if the team is burnt out or a supplier risk hasn't been logged. That's why effective tracking pairs quantitative metrics like time and budget with qualitative checks; relying on either alone hides the real picture. A budget sitting at 40% spent with 60% of the timeline elapsed looks fine on a spreadsheet, right up until you learn the remaining 60% of budget was meant to cover the hardest, most expensive phase.
How do you write a status report people will actually read?
A status report earns attention when it's short enough to scan in ninety seconds and specific enough to prompt a decision. Standard templates increase transparency and save the time otherwise spent reformatting the same information every week.
A workable one-page structure runs in this order:
- Executive summary, two sentences, what changed since last time.
- RAG headline, green, amber or red, with a one-line reason attached.
- Key metrics, the 3–5 KPIs from above, no more.
- Milestones, what's done, what's next, what's slipped.
- Top risks, ranked, with an owner and a mitigation note.
- Decisions needed and next steps, the only section that should ever grow.
Length and cadence shift by audience. Team-level updates can run longer and more detailed, since the people reading them already know the context. Manager reports tighten that down to the essentials. Executive summaries should fit on a phone screen without scrolling, and the RAG line should never be the only thing they see.
Who owns updates, and how often should they happen?
Governance is the difference between a dashboard that's trusted and one that's quietly ignored. Cadence works best layered: daily standups for the team catching blockers in real time, a weekly status report rolling that up for managers, and a monthly executive review focused purely on trend and risk.
- Task owners update their own items daily, nobody else should be typing on their behalf.
- A project manager validates the roll-up before it goes anywhere, catching the task marked "done" that clearly isn't.
- Sponsors and stakeholders review the summary on the agreed cadence, not whenever they happen to open the dashboard.
Setting a baseline before work starts gives you something fixed to measure drift against. Without one, "on track" is just an opinion. Version that baseline too, because a plan that quietly shifts every fortnight without anyone noting the change is how scope creep gets its start.
Why do "watermelon projects" happen, and how do you stop them?
A watermelon project looks green on the outside and is red underneath, every dashboard says "on track" right up until the deadline everyone missed. Pairing RAG indicators with a short mandatory risk log closes that gap: a project should never sit at green while an unmitigated high-impact risk sits on the critical path.
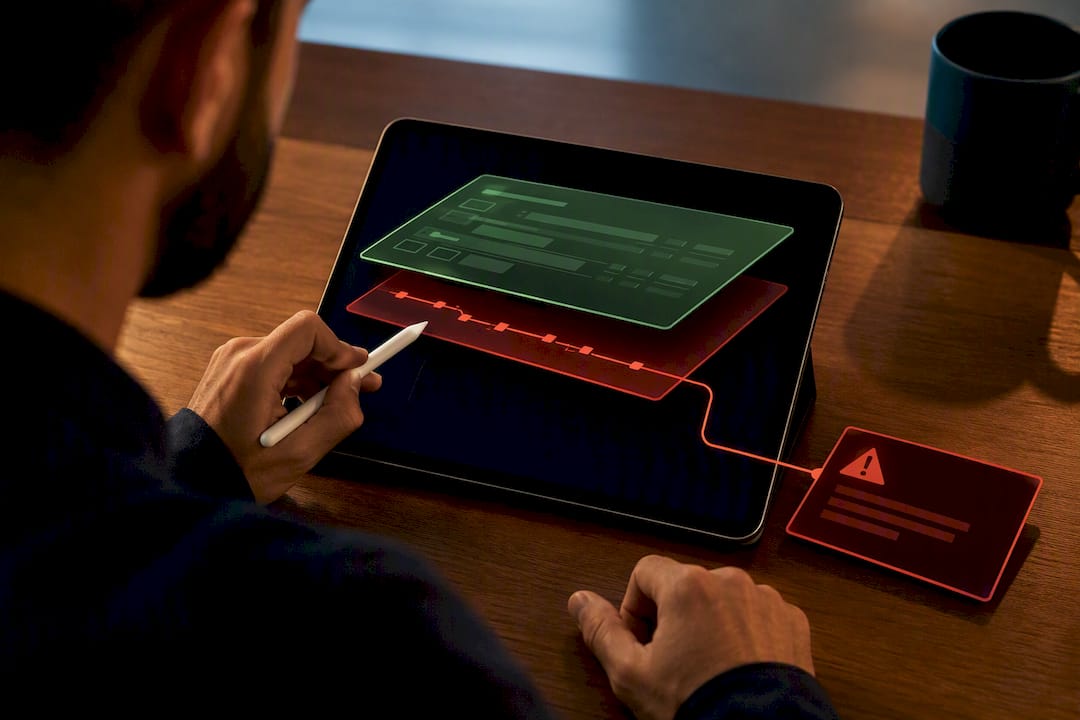
The other common failure is data sprawl, three spreadsheets, two chat threads and a dashboard nobody updated since last month, each telling a slightly different story.
Pro Tip: Make the risk note mandatory, not optional, on every status update. A single sentence, "supplier delay likely, no backup vendor confirmed," does more to prevent a watermelon project than any colour-coded chart ever will.
Putting this into practice with Seven
Seven maps onto this framework directly. Workspaces separate projects so status data doesn't cross-contaminate between teams, task import from spreadsheets gets you off the sprawl fast, and due-date tracking with overdue alerts feeds the "tasks completed and overdue" metric automatically.
Setup takes an afternoon: import your existing task list, set due dates and owners, then check the dashboard against the 3–5 KPIs above before adding anything else. Seven runs on a subscription model without analytics or data mining, which matters if your status reports touch client budgets or unreleased product timelines you'd rather not have mined for someone else's insight. The due-date tracking setup guide walks through the specifics.
When to keep tracking light versus building it heavy
Small teams don't need a six-tab dashboard. A Kanban board and a five-minute weekly written snapshot often beat a heavy reporting stack, because the overhead of maintaining that stack can cost more decision-making time than it returns. Scale up metrics only when the team, or the stakes, genuinely demand it.
— Greg
Seven: build your status tracking around one privacy-first source of truth
Seven gives you the pieces this article just walked through, without the vendor lock-in that comes with most enterprise platforms. Workspaces keep each project's status data separate and clean. Task import pulls your existing spreadsheet mess into one structured view in minutes, no re-entering hundreds of rows by hand.
Dashboards surface the KPIs that matter, tasks completed, overdue items, milestone progress, without needing a data analyst to build them. Due-date tracking and overdue alerts do the quiet work of flagging risk before it becomes a watermelon project. For teams juggling client work or anything commercially sensitive, Seven's security and privacy design means none of that status data gets mined, sold, or trained into someone else's model.
If your tracking currently lives across three spreadsheets and a group chat, start the 7-day free trial on the Seven project management platform this week, import your task list, and see your first real dashboard by Friday.
Sources
FAQ
How do you track a project's status?
Combine a handful of quantitative KPIs (tasks completed, budget vs actual, overdue items) with a short qualitative risk note, publish both on one shared dashboard, and review them on a fixed cadence such as weekly.
What are the statuses of a project?
Most teams use a simple set: not started, in progress, on hold, completed, and at risk or blocked, often layered with a RAG (red, amber, green) indicator for quick scanning.
What are the five stages of a project?
The standard project lifecycle runs through initiation, planning, execution, monitoring and controlling, and closure, with status tracking happening continuously through the execution and monitoring stages.
What's the best way to track project progress?
There's no single best method, but the most reliable approach mixes a visual tool (Gantt chart, Kanban board or burndown chart) with a small set of tracked metrics and a regular written status report, rather than relying on any one of those alone.
How often should project status be updated?
Task-level updates should happen daily, status reports should go out weekly for team and manager audiences, and executive summaries typically work best on a monthly cycle unless the project is in a high-risk phase.